Electricity Power Use
What drives power use in Toronto?
Daily Power Use
Use top left buttons or bottom slider to explore different time periods
Factors Impacting Power Use
Feeding power use data along with several time and environmental factors into an ML boosting model then into a SHAP explainer model reveals the impact of each factor
Top 3 impactful factors
- Hour of day is the most important factor with 2200 MWh swing throughout the day (average hourly use = 5800 MWh)
- Temperature The warmest hours of the year can increase power use 3x the lowest use hours
- Weekday vs Weekend is also very impactful with up to 1500 MWh throughout the week
There's a few minor factors that also have some impact
- Holidays shows significant power reduction
- High humidity and daylight weather factors also increase power use slightly
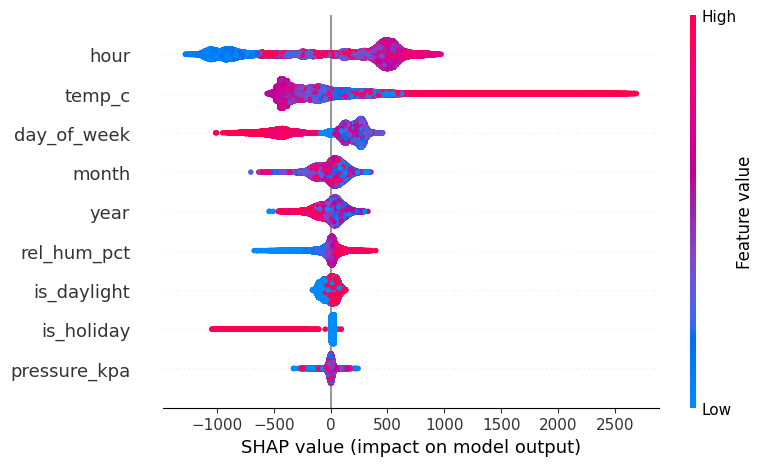
SHAP values attempt to capture the effect of each factor independantly
Factors with the greatest impact are listed top to buttom
Red dots = higher value for the factors (higher temperature, later hours in the day)
Dots to the right = increases power use
Power use is highly cyclical
1. Daily power use ramps up in the morning, peaks around 5-7pm and drops to a low around 3am
2. The weekly cycle is also very visible, with weekends (days 6-7) using significantly less power than weekdays (days 1-5); Sunday's power use cycle starts increasing later in the day vs Saturday
Temperature is the other key factor
Temperature increase will significantly increase peak power usage
Simulated 2021 power usage with ML model using modified temperatures